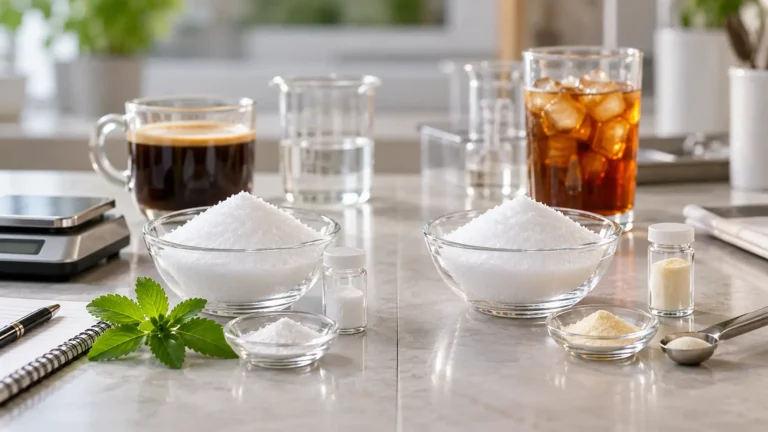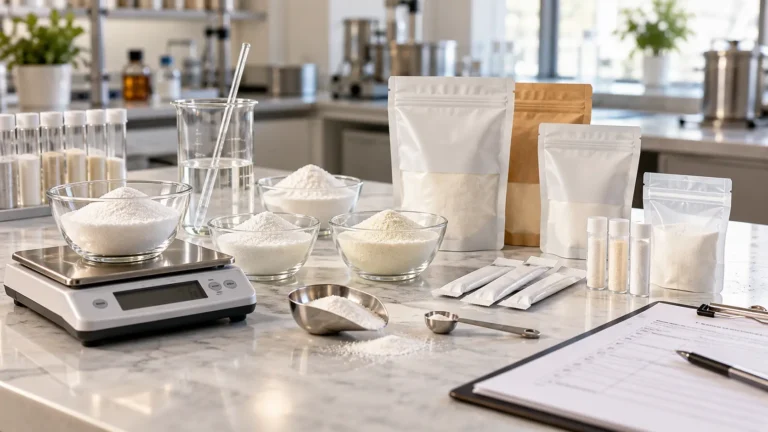
Reb A vs Reb M — both are steviol glycosides extracted or derived from the Stevia rebaudiana leaf. Both are 200–350× sweeter than sucrose. Both carry GRAS status and appear in the same regulatory frameworks. On paper, they look interchangeable. In practice, they are not — and the reason is not sweetness potency, but what happens to sweetness when bitterness co-activates alongside it.
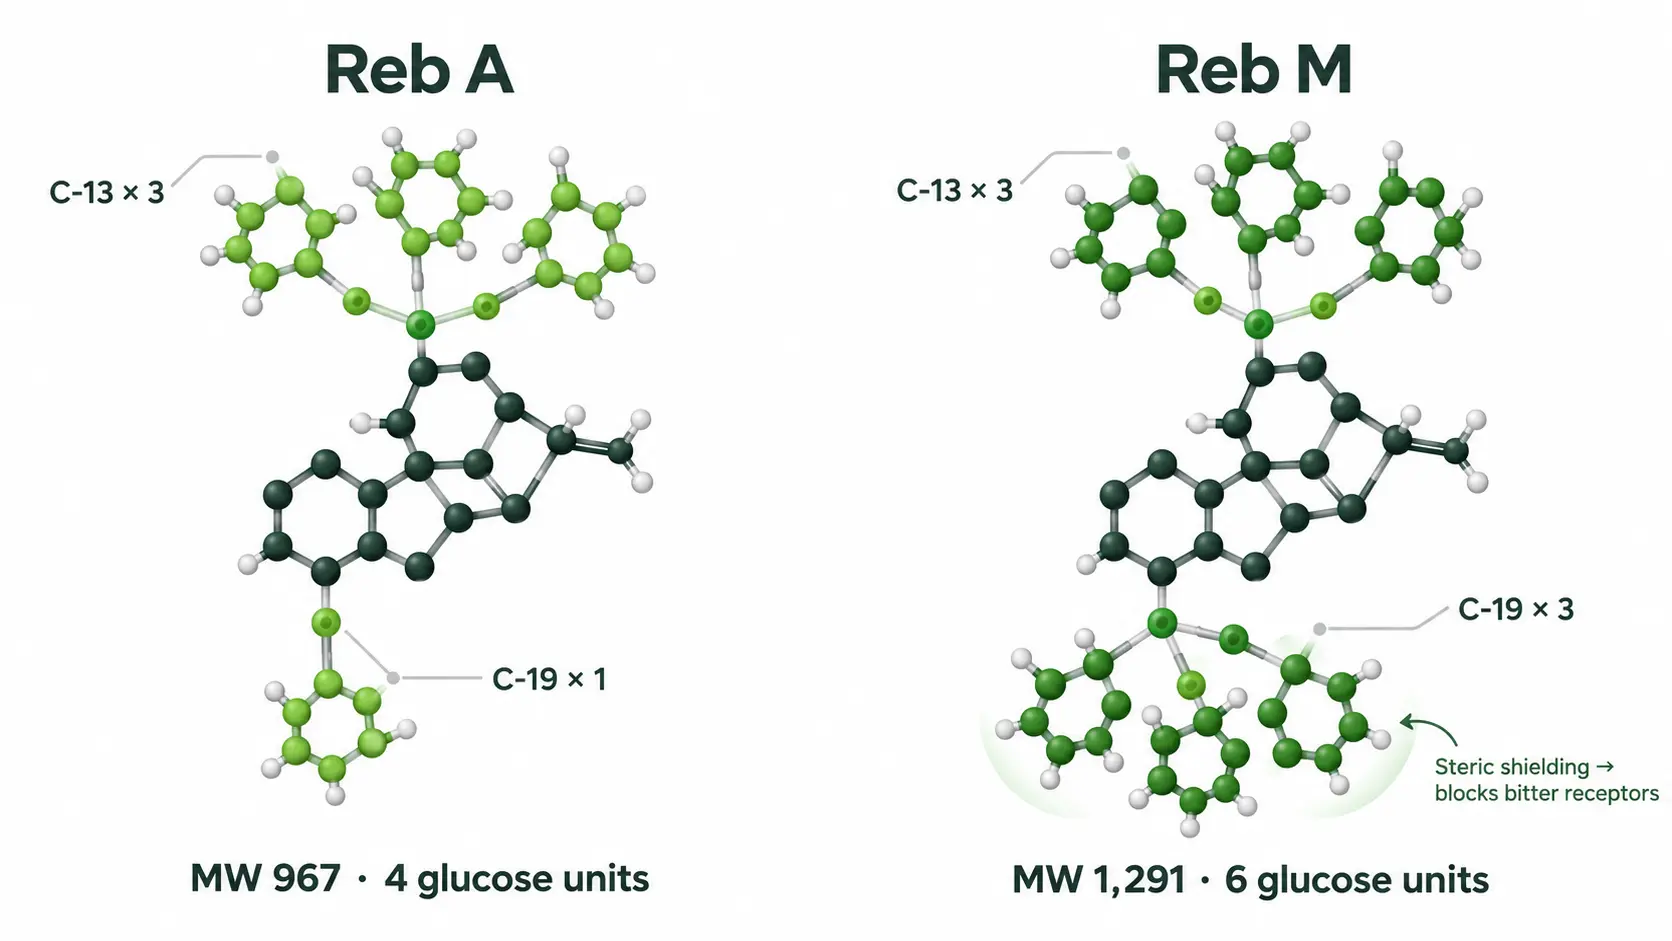
Reb A (rebaudioside A) carries 4 glucose units and triggers bitter receptors hTAS2R4 and hTAS2R14 at formulation-relevant concentrations. Reb M (rebaudioside M) carries 6 glucose units, creating enough steric bulk to shield those same receptors. The result: in side-by-side sensory panels, Reb M’s perceived sweetness is statistically indistinguishable from sucrose. Reb A’s is not.
One disclosure. We supply both rebaudioside A and rebaudioside M. We have no margin incentive to push one over the other. Every claim below is referenced against peer-reviewed sensory studies, receptor-binding data, regulatory filings and commercial pricing, and you should read with that commercial context in mind.
This Reb A vs Reb M comparison covers molecular structure, receptor-binding mechanisms, quantitative sensory-panel data, the bitterness penalty that suppresses Reb A’s perceived sweetness, solubility and stability, cost-per-serving economics, blending strategies, production and labeling compliance, and a decision framework for choosing between them.
01 · Short answer
Reb M Tastes Like Sugar. Reb A Tastes Like Stevia.
If your formulation goal is the closest possible match to sucrose — clean onset, sugar-like body, no lingering aftertaste — Reb M is the better molecule. Two independent sensory panels (126 and 92 tasters respectively) found that Reb M’s sweetness was not statistically different from sucrose (p = 0.55 in water; p = 0.609 in ice cream). Reb A was significantly different from sucrose in both studies.[1][2]
Put it in everyday terms: if you have ever tasted a zero-calorie drink sweetened only with stevia and noticed a medicinal, slightly metallic bitterness that lingers seconds after the sip — that is Reb A’s signature. Reb M, by contrast, rises and fades the way sugar does. The sweetness arrives, fills the mid-palate and exits cleanly. No bitter tail chasing you to the second sip. In a blind tasting, most consumers cannot tell a Reb M solution from a sucrose solution — the panel data in Section 03 confirms this with statistical tests across 218 tasters.
If your formulation already uses masking agents (erythritol, monk fruit, flavour modifiers), your matrix is opaque or strongly flavoured, or your primary driver is ingredient cost — Reb A at $84–150/kg may deliver an acceptable result at a fraction of Reb M’s $300–500/kg price. The question is not which molecule is “better” in isolation. It is which one costs less to reach your sensory target in your specific product.
If you already know your application, skip to the decision framework. If you want the evidence, read on.
02 · Molecular structure
4 Glucose Units vs 6: Why the Difference Matters
All steviol glycosides share the same diterpene core — steviol. What differs is the number and arrangement of glucose (and occasionally rhamnose or xylose) units attached at two positions: C-13 and C-19. Those sugar decorations control three things: sweetness intensity, bitterness, and how quickly the sweet taste fades.
Structural comparison
| Property | Reb A | Reb M |
|---|---|---|
| Full name | Rebaudioside A | Rebaudioside M |
| Molecular formula | C44H70O23 | C56H90O33 |
| Molecular weight | 967.01 g/mol | 1 291.29 g/mol |
| Total glucose units | 4 | 6 |
| C-13 glucosyls | 3 (trisaccharide) | 3 (trisaccharide) |
| C-19 glucosyls | 1 (single glucose) | 3 (trisaccharide) |
| Sweetness potency | 200–300× sucrose | 200–350× sucrose |
| CAS number | 58543-16-1 | 1220616-44-3 |
How C-13 and C-19 glucosyls divide the work
Wang and colleagues (2025) established the functional split between the two attachment sites through systematic structure–activity modelling across 12 steviol glycosides:[3]
- C-13 glucosyls drive sweetness intensity. More glucose units at C-13 produce a stronger, faster sweet signal. Both Reb A and Reb M carry 3 glucose units at C-13, which is why their theoretical sweetness potency ranges overlap.
- C-19 glucosyls control how quickly sweetness fades. More glucose units at C-19 increase the desorption rate from the sweet receptor, producing a faster sweetness decay and a shorter aftertaste. Reb A has 1 glucose at C-19; Reb M has 3. This is the molecular basis for Reb M’s clean, sugar-like finish versus Reb A’s lingering, often bitter, tail.
Sweet receptor binding
The human sweet receptor is a heterodimer of T1R2 and T1R3 subunits with four known binding sites: VFD2, VFD3, TMD2 and TMD3. Molecular docking studies (Gao & Chen, 2024) calculated the binding affinity of both molecules at the primary orthosteric site VFD2:[4]
| Molecule | VFD2 binding energy | Relative |
|---|---|---|
| Reb M | −135.74 kcal/mol | Baseline |
| Reb A | −104.33 kcal/mol | ~30 % weaker |
| Stevioside | −89.12 kcal/mol | ~34 % weaker |
Gao & Chen also reported the equilibrium dissociation constant (Kd) for the Reb M–G protein complex at 0.2797 nM — an exceptionally tight binding affinity that helps explain why Reb M’s sweetness onset feels immediate.[4]
Taken together: Reb M binds the sweet receptor about 30 % more tightly than Reb A at the same site, and its sub-nanomolar Kd means the signal fires reliably even at low concentrations. Combined with 3 C-19 glucosyls enabling faster desorption after the signal fires, this produces a sweet taste that rises quickly, peaks cleanly and exits without a bitter tail — the hallmark of sucrose-like character.
Why more glucose does not always mean more sweetness
The potency ranges of Reb A (200–300×) and Reb M (200–350×) overlap. At very low concentrations (2 % sucrose equivalence), Reb A can actually match or exceed Reb M in perceived sweetness. The divergence appears at formulation-relevant concentrations (8–10 % sucrose equivalence), where Reb A’s bitter co-activation begins to suppress perceived sweetness — a phenomenon Section 05 quantifies as the “bitterness penalty.”[3]
03 · Sensory evidence
What 218 Trained Tasters Actually Measured
Most Reb A vs Reb M comparisons online rely on vague descriptors (“Reb M tastes more like sugar”). Two peer-reviewed studies put numbers behind that claim, using trained panels, standardised protocols and statistical tests.
Study 1: Water matrix — 126 panelists
Muenprasitivej et al. (2022) recruited 126 regular stevia consumers and evaluated seven steviol glycoside preparations in water at concentrations matched to 6 % sucrose. Key results for the Reb A vs Reb M comparison:[1]
| Attribute | Sucrose (6 %) | Reb M | Reb A |
|---|---|---|---|
| Overall sweetness (0–15 scale) | 8.5 | 9.0 | 2.5 |
| Bitterness (0–15 scale) | 0.3 | 0.8 | 4.2 |
| vs sucrose (p-value) | — | p = 0.55 (NS) | p < 0.05 (sig.) |
Reb M scored higher than sucrose on sweetness and was not statistically different from it (p = 0.55). Reb A scored less than one-third of sucrose’s sweetness at the same concentration and was significantly different.
The study used Check-All-That-Apply (CATA) profiling. Reb M was most frequently described as “sweet,” “pleasant” and “sugar-like.” Reb A was most frequently described as “bitter,” “metallic” and “lingering.”
Study 2: Ice cream matrix — 92 panelists
Saraiva et al. (2023) tested steviol glycoside replacements for sucrose in vanilla ice cream with 92 consumers. The Reb A vs Reb M pattern held even in a complex matrix:[2]
| Attribute | Sucrose control | Reb M ice cream | Reb A ice cream |
|---|---|---|---|
| Sweetness acceptance (9-pt hedonic) | 7.1 | 6.9 | 5.4 |
| Overall liking (9-pt hedonic) | 7.3 | 6.8 | 5.1 |
| vs sucrose (p-value, sweetness) | — | p = 0.609 (NS) | p < 0.05 (sig.) |
| Purchase intent | 68 % | 61 % | 38 % |
In ice cream — a matrix with fat, dairy protein and vanilla flavour to mask off-notes — Reb M still achieved sweetness scores not statistically different from sucrose (p = 0.609). Reb A remained significantly different, and its purchase intent was nearly half that of the sucrose control.
Across 218 tasters, two matrices and two independent research groups, the same result: Reb M’s sweetness is indistinguishable from sucrose. Reb A’s is not.
What CATA profiling reveals
Check-All-That-Apply (CATA) asks panelists to select every descriptor that applies from a fixed list, without ranking or scaling. In Study 1, Reb M’s descriptor profile clustered with sucrose in principal-component space. Reb A clustered away from both, driven by “bitter,” “metallic” and “lingering” selections. This means the difference is not just intensity — it is the character of the sweetness.
04 · Solubility & stability
Reb A Dissolves 8× Better — but Both Survive Your Process
Solubility
Solubility is one dimension where Reb A clearly outperforms Reb M. The difference is large enough to influence formulation strategy:
| Property | Reb A | Reb M (crystalline) | Reb M (amorphous) |
|---|---|---|---|
| Solubility at 25 °C | ~0.8 % (8 000 ppm) | ~0.1 % (1 000 ppm) | 1.1–1.3 % |
| Relative to Reb A | Baseline | 8× lower | ~1.5× higher |
| Practical impact | Dissolves easily at typical beverage concentrations (200–500 ppm) | May require pre-dissolution in warm water above 300 ppm | Higher initial solubility but may recrystallise on storage |
At typical use levels for a zero-calorie beverage (200–500 ppm active glycoside), Reb A dissolves completely at room temperature with no special handling. Reb M at the same concentrations approaches or exceeds its crystalline solubility ceiling, which can cause haze in clear beverages. In our experience shipping Reb M to beverage formulators, the solubility question comes up in every initial conversation — and almost never comes back after the first pilot batch, because the workarounds below are straightforward. For more on Reb M’s solubility behaviour by purity grade, see our Reb M 95 vs 98 purity comparison.
Thermal and pH stability
Prakash et al. (2014) tested both molecules under conditions representative of beverage processing:[5]
| Condition | Reb A recovery | Reb M recovery |
|---|---|---|
| pH 3.0, 80 °C, 2 hours | 96–98 % | 95–97 % |
| pH 4.0, 80 °C, 2 hours | 98–99 % | 97–99 % |
| Carbonated soft drink, 37 °C, 24 weeks | 97 % | 96 % |
Under realistic processing conditions (pH 3–4, pasteurisation temperatures, months of shelf storage), both molecules retain > 95 % of their initial concentration. Stability is not a differentiator in the Reb A vs Reb M comparison. Both survive UHT, HTST, hot-fill and retort processing. The degradation pathway at extreme conditions (pH ≤ 2.5, > 120 °C, extended hold times) involves hydrolysis of glucose units from the steviol core — a reaction that affects all steviol glycosides equally.
Reb M solubility workaround
If you choose Reb M for taste but need better dissolution, three approaches work: (1) use amorphous (spray-dried) Reb M, which dissolves to 1.1–1.3 %; (2) pre-dissolve crystalline Reb M in 60–80 °C water before adding to the batch; (3) blend Reb M with erythritol or other bulking agents at > 1 %, which acts as a co-solvent. All three are standard practice in commercial Reb M beverage formulations.
05 · The bitterness penalty
Why Reb A’s Theoretical Sweetness Never Arrives in the Cup
This section explains the single most important — and most widely overlooked — difference between Reb A and Reb M. It is the reason Reb A’s sweetness potency on a data sheet (200–300×) does not predict its performance in a finished product.
The mechanism: bitter receptor co-activation
Sweetness potency is measured by matching sweetener solutions to sucrose references. In those tests, Reb A and Reb M both score 200–300×+. But sweetness potency tests isolate sweetness. In a real formulation, bitterness and sweetness are perceived simultaneously — and they suppress each other.
Hellfritsch and colleagues (2012) identified the specific bitter receptors responsible: hTAS2R4 and hTAS2R14. These receptors respond to steviol glycosides at concentrations encountered in food use.[6]
The key structural insight: glucose units at C-13 and C-19 create steric hindrance that blocks access to the bitter receptor binding pocket. More glucose = more steric bulk = weaker bitter signal:
| Molecule | Total glucose units | Bitter receptor activation | Effect on perceived sweetness |
|---|---|---|---|
| Stevioside | 3 | Strong | Heavily suppressed |
| Reb A | 4 | Moderate | Suppressed by 40–60 % |
| Reb D | 5 | Weak | Mildly suppressed |
| Reb M | 6 | Minimal | Not suppressed |
The concentration trap
Reb A’s sweetness potency is concentration-dependent — and this works against the formulator at exactly the concentrations that matter. Wang et al. (2025) reported the following potency values:[3]
| Sucrose equivalence | Reb A potency (Pw) | Reb M potency (Pw) |
|---|---|---|
| 2 % sucrose | 435× | — |
| 5 % sucrose | ~300× | 347× |
| 10 % sucrose | 238× | 159× |
At 2 % sucrose equivalence, Reb A looks spectacularly efficient: 435×. But no commercial beverage targets 2 % sweetness. Most target 8–12 % sucrose equivalence, where Reb A has already dropped to 238× — and that number still does not account for the bitterness penalty.
Theoretical potency vs perceived sweetness
Here is the calculation that exposes the gap. At 0.1 % concentration in water, the sensory panel (Study 1) measured:[1]
| Molecule | Concentration | Theoretical sweetness (from Pw) | Measured sweetness (0–15 panel score) | Delivery rate |
|---|---|---|---|---|
| Sucrose | 6 % | 6 % | 8.5 | 100 % |
| Reb M | 0.1 % | ~6 % SE | 9.0 | ~106 %* |
| Reb A | 0.1 % | ~6 % SE | 2.5 | ~29 %* |
The bitterness penalty
The delivery-rate column is an approximation — dividing ordinal panel scores is not strictly valid — but the direction is unambiguous: at the same concentration, Reb A delivers roughly a third of the sweetness that its potency value predicts, while Reb M delivers at or above its predicted level. Reb A’s theoretical advantage evaporates because bitter receptor co-activation suppresses a large fraction of its perceived sweetness. Formulators who dose Reb A based on published potency values (200–300×) will undershoot their sweetness target substantially — and the undershoot arrives with bitterness attached.
What this costs in practice
To compensate for the bitterness penalty, Reb A formulations typically require:
- 15–20 % overdose above the concentration predicted by the Pw curve — which increases bitterness further, requiring additional masking
- Masking agents (erythritol, monk fruit extract, flavour modifiers) to suppress the bitter/metallic notes that the overdose amplifies
- More complex label declarations — every masking agent is an additional line on the ingredient list
Reb M requires none of these. Its perceived sweetness matches its potency prediction because there is no meaningful bitter co-activation to subtract from it. The total formulation cost of Reb M must be compared not against the raw Reb A price, but against the all-in cost of Reb A + overdose + masking agents — a calculation Section 06 works through.
06 · Economics
The Real Cost Is Per Serving, Not Per Kilogram
Raw ingredient price per kilogram is the number most buyers compare first. It is also the least useful number in the Reb A vs Reb M decision. When you convert price-per-kilo into cost-per-serving, the gap narrows at every step — and by the time you reach a finished can, the difference is smaller than most formulators expect.
Layer 1: Raw ingredient price
| Ingredient | Price range (2025) | Source |
|---|---|---|
| Reb A (≥ 95 %) | $84–150 / kg | Bulk supplier data |
| Reb M (≥ 95 %) | $300–500 / kg | Bulk supplier data |
| Reb M : Reb A price ratio | 3–4× | — |
At this layer, Reb M looks 3–4× more expensive. We see this in quoting conversations constantly: buyers compare per-kilo prices, conclude Reb M is “too expensive,” and move on. They shouldn’t — because the per-kilo number ignores what happens at the next two steps.
Layer 2: Dose-adjusted cost
To reach the same perceived sweetness (not the same theoretical sweetness), Reb A requires a higher dose and masking agents. Using the sensory data from Section 05:
| Parameter | Reb M | Reb A (with masking) |
|---|---|---|
| Target sweetness | 8 % sucrose equivalence in beverage | |
| Active glycoside needed | ~300 ppm | ~420 ppm (+15 % overdose + masking adjustments) |
| Erythritol needed | 0 | 5 000–10 000 ppm (0.5–1 %) for bitterness masking |
| Glycoside cost per litre | $0.012–0.015 | $0.004–0.006 |
| Erythritol cost per litre | $0 | $0.003–0.005 |
| Total sweetener cost per litre | $0.012–0.015 | $0.007–0.011 |
| Effective price ratio | 1.4–2× (down from 3–4×) | |
Layer 3: Per-can economics
For a 355 mL (12 oz) can:
| Cost component | Reb M formulation | Reb A + erythritol formulation |
|---|---|---|
| Sweetener system cost | $0.0043–0.0053 | $0.0025–0.0039 |
| Aluminium can + filling | $0.08–0.12 | |
| Flavour, acid, carbonation | $0.01–0.02 | |
| Total COGS per can | $0.094–0.145 | $0.093–0.144 |
| Sweetener as % of total COGS | 3–4 % | 2–3 % |
At can level, the sweetener cost difference between Reb A and Reb M is roughly $0.001–0.002 per serving — less than 2 % of total COGS.
The 3–4× headline price gap shrinks to less than 2 % of total product cost once you account for dose adjustment and co-ingredients. For premium, clean-label or “no artificial sweetener” positioning, the incremental $0.001–0.002 per can buys a simpler label, no masking agents and a sensory profile indistinguishable from sucrose. Whether that trade-off is worth it depends on your brand positioning and price tier, not on the raw per-kilo number.
07 · The third path
Blending: Reb M + Reb A May Be Better Than Either Alone
The Reb A vs Reb M comparison is not always a binary choice. Blending strategies let you capture most of Reb M’s taste advantage at a cost closer to Reb A — and the right approach depends on where your product sits on the cost–quality spectrum.
Strategy 1: Reb M + Reb A blend
Prakash et al. (2014) tested binary blends of steviol glycosides in acidified water at pH 3.2. A Reb M 300 ppm + Reb A 100 ppm blend improved sweetness quality and reduced the leafy/vegetal note compared to Reb A alone:[5]
- Mechanism: Reb M provides the sweetness backbone (fast onset, clean decay). Reb A contributes mid-note body. At 100 ppm, Reb A’s bitterness stays below perceptible threshold — it is only at higher concentrations (200+ ppm as primary sweetener) that the bitter co-activation becomes problematic.
- Cost benefit: Replacing 25 % of the Reb M dose with Reb A reduces the glycoside cost by roughly 20 % while preserving a sugar-like profile.
Strategy 2: Reb M + erythritol
Erythritol at > 1 % acts both as a bulking agent and a sweetness profile modifier. Combined with Reb M at 200–300 ppm:
- Sweetness rounding: Erythritol fills the mid-palate gap that high-intensity sweeteners leave. The result is a body and mouthfeel closer to a sucrose solution.
- Reduced Reb M dose: Erythritol contributes roughly 0.7× the sweetness of sucrose, so at 1 % it replaces the equivalent of 0.7 % sucrose, allowing a corresponding reduction in Reb M.
- Improved dissolution: Erythritol in solution acts as a co-solvent, helping crystalline Reb M dissolve at concentrations that would otherwise approach the solubility ceiling.
Strategy 3: Glycosylated Reb A + erythritol
Enzymatic glycosylation adds extra glucose units to Reb A, increasing its steric bulk and reducing bitter receptor access. In a sensory evaluation of glycosylated Reb A blended 1:1 with erythritol:[7]
| Formulation | Bitterness score | Sweetness potency | Sucrose similarity |
|---|---|---|---|
| Standard Reb A | 5.3 | 235× | Low |
| Glycosylated Reb A | 2.7 | ~155× | Moderate |
| Glycosylated Reb A + erythritol (1:1) | 1.6 | ~155× | “Not differentiated from sucrose” |
The trade-off: glycosylation reduces potency from 235× to ~155×, so you need 50 % more glycoside by weight to reach the same sweetness. But glycosylated Reb A costs far less than Reb M, and the result approaches sucrose similarity at a price point between standard Reb A and Reb M.
Choosing a blending strategy
Strategy 1 (Reb M + Reb A) is best suited for premium clean-label products where you want to minimise ingredient count. Strategy 2 (Reb M + erythritol) works when mouthfeel and body matter as much as taste — typical in carbonated soft drinks and flavoured waters. Strategy 3 (glycosylated Reb A + erythritol) offers the lowest cost path to sucrose-like taste, but with a more complex label and lower potency. Your choice depends on your target cost, label requirements and the sensory profile your consumers expect.
08 · Production & labeling
How They Are Made Changes What You Can Call Them
Production pathways
Reb A and Reb M reach the market through fundamentally different supply chains, and those differences have direct consequences for labeling, cost and availability.
| Route | Reb A | Reb M |
|---|---|---|
| Leaf extraction | Primary route. Reb A is 2–4 % of stevia leaf dry weight. Mature extraction technology, multiple supplier countries (China, Paraguay, Kenya). Low cost. | Impractical. Reb M is < 0.1 % of leaf dry weight. Extracting it at commercial scale would require > 20× the leaf biomass per kilogram of product. |
| Enzymatic bioconversion | Not needed — leaf extraction is sufficient. | Major route. Reb A → Reb D → Reb M via UDP-glucosyltransferase enzymes. The substrate is leaf-extracted Reb A, so the process depends on the Reb A supply chain. |
| Fermentation | Not needed. | Major route. Engineered yeast (Yarrowia lipolytica, Saccharomyces cerevisiae) or other microorganisms produce Reb M from simple sugars. No stevia leaf involved. Cargill EverSweet™ (launched 2018) uses this route. |
Reb A’s production is simple: extract from leaves. Reb M has three routes, and each produces a product with different regulatory and labeling implications.
Regulatory status
| Market | Reb A | Reb M |
|---|---|---|
| United States (FDA) | GRAS since 2008 (GRN 252) | GRAS since 2014 (GRN 512) |
| European Union | E 960 (authorised 2011) | E 960c (authorised 2021–2022) |
| China | GB 1886.355 (steviol glycosides) | GB 1886.355 (steviol glycosides) |
| Japan (JSFA) | Approved as steviol glycoside | Approved as steviol glycoside |
| JECFA / Codex | JECFA spec, ADI 0–4 mg/kg bw steviol equivalents | Same ADI applies (calculated as steviol equivalents) |
Both molecules are approved in all major markets. The regulatory difference is not whether they are approved, but how the approval interacts with labeling.
The labeling trap
Critical for clean-label brands
Fermentation-derived Reb M cannot be labelled “stevia leaf extract” or “stevia extract” in most markets. Because the molecule was produced by yeast, not extracted from a plant, regulators classify it differently. Acceptable label terms include “steviol glycosides,” “rebaudioside M,” or the E-number (E 960c in the EU). For brands built on “natural,” “plant-based” or “stevia-sweetened” positioning, this is a significant constraint.
Leaf-extracted Reb A can always be labelled “stevia leaf extract.” Enzymatically produced Reb M — where the substrate is leaf-extracted Reb A — occupies a grey area that varies by jurisdiction and by manufacturer’s legal interpretation. Fermentation-derived Reb M is unambiguously not a plant extract.
If clean-label or plant-based positioning is central to your brand, verify the production pathway before you source Reb M. Ask the supplier: (1) Is this leaf-extracted, enzymatically converted, or fermentation-derived? (2) What is the starting substrate? (3) What label claims has your regulatory team validated in my target markets?
09 · Decision framework
Three Questions to Decide Between Reb A and Reb M
The Reb A vs Reb M decision reduces to three questions about your product, your brand and your margin structure.
Question 1: How close to sucrose does your product need to taste?
- Must match sucrose (premium positioning, clean-label, no masking agents): Use Reb M, or a Reb M–dominant blend. The sensory data is unambiguous: Reb M is not statistically different from sucrose; Reb A is.
- Acceptable with masking agents (cost-driven, strong-flavour matrix): Reb A with erythritol or monk fruit can reach an acceptable profile at lower cost — if you have room on the label and in the formulation for the masking system.
Question 2: Does your label strategy allow “steviol glycosides” or does it require “stevia leaf extract”?
- “Stevia leaf extract” required: Use Reb A (always leaf-extracted), or source Reb M specifically from enzymatic bioconversion of leaf-extracted precursors. Verify the labeling claim with your regulatory counsel.
- “Steviol glycosides” acceptable: Any production route works. Fermentation-derived Reb M (e.g. Cargill EverSweet) offers a scalable supply.
Question 3: Does the $0.001–0.002 per serving cost difference change your margin equation?
- Yes (high-volume, price-sensitive): Reb A or a Reb M + Reb A blend may be the right trade-off. Run a sensory panel with your specific matrix before committing — the bitterness penalty varies by product.
- No (premium tier, marketing value of “sugar-like taste”): Reb M pays for itself in simpler formulation, shorter label and consumer preference.
Quick-reference comparison
| Dimension | Reb A | Reb M | Winner |
|---|---|---|---|
| Taste (sucrose similarity) | Significantly different from sucrose | Not significantly different | Reb M |
| Bitterness | Moderate (hTAS2R4/R14 activation) | Minimal (steric shielding) | Reb M |
| Solubility (25 °C) | ~0.8 % | ~0.1 % (crystalline) | Reb A |
| Thermal / pH stability | > 95 % retained | > 95 % retained | Tie |
| Raw price per kg | $84–150 | $300–500 | Reb A |
| Cost per serving (all-in) | $0.0025–0.0039 | $0.0043–0.0053 | Reb A (narrowly) |
| Label simplicity | Simple (leaf extract) | Depends on production route | Reb A (leaf) or Tie |
| Leaf content | 2–4 % of dry weight | < 0.1 % of dry weight | Reb A (supply) |
| GRAS / EU approved | Yes (2008 / 2011) | Yes (2014 / 2021–22) | Tie |
| Need for masking agents | Typically yes | No | Reb M |
Market context
The global stevia sweetener market reached approximately $1.4 billion in 2025 and is projected to grow to $2.5 billion by 2035 (6.2 % CAGR). Reb A still accounts for roughly 60 % of commercial stevia volume. But the share of Reb M and other next-generation glycosides (Reb D, enzyme-modified stevia) is growing as major brands — Coca-Cola, PepsiCo, Nestlé — reformulate toward cleaner taste profiles. Coca-Cola began blending stevia (including Reb M) into Coke Zero formulations in 2023–2024.[8]
Next step
Request Samples and Run Your Own Comparison
We supply both rebaudioside A and rebaudioside M in formulation-grade quantities. Every lot ships with a full HPLC glycoside profile and a certificate of analysis. If you are unsure where your product falls, we typically recommend starting with a 200 g sample kit of both molecules and running a bench-top triangle test in your own matrix — most R&D teams have a clear answer within a week.
For Reb M purity grade selection, see our Reb M 95 vs 98 purity comparison. For Reb M vs Reb D, see our upcoming Reb D vs Reb M guide.
FAQ
Frequently Asked Questions
Is Reb M just a more expensive version of Reb A?
No. Reb A and Reb M are chemically distinct molecules with different molecular weights (967 vs 1 291 g/mol), different numbers of glucose units (4 vs 6) and fundamentally different bitter-receptor interactions. Reb M is not a purer or premium “version” of Reb A — it is a different steviol glycoside with a different taste profile. The price difference reflects production difficulty (Reb M is < 0.1 % of the leaf vs Reb A’s 2–4 %), not simply a purity premium.
Why does Reb A taste bitter but Reb M does not?
Both molecules activate the T1R2/T1R3 sweet receptor. But Reb A also activates human bitter receptors hTAS2R4 and hTAS2R14. The difference comes from molecular geometry: Reb M’s 6 glucose units create greater steric bulk around the steviol core, physically blocking access to the bitter receptor binding pocket. Reb A, with only 4 glucose units, lacks sufficient steric shielding, allowing moderate bitter receptor activation at formulation-relevant concentrations.
Can I blend Reb A and Reb M to save cost without sacrificing taste?
Yes. A blend of Reb M at 300 ppm with Reb A at 100 ppm has been shown to improve sweetness quality over Reb A alone while reducing cost versus pure Reb M. The key is keeping Reb A below the concentration where its bitterness becomes perceptible (~200 ppm as primary sweetener). At 100 ppm as a secondary sweetener behind Reb M, Reb A contributes mid-note body without triggering meaningful bitter receptor activation.
Is fermentation-derived Reb M “natural”?
That depends on your market and your regulatory counsel’s interpretation. Fermentation-derived Reb M is chemically identical to leaf-extracted Reb M, but it was produced by engineered yeast, not extracted from a plant. Most regulators do not permit the label “stevia leaf extract” or “stevia extract” for fermentation products. “Natural flavour” or “natural sweetener” claims vary by jurisdiction. If “plant-based” or “stevia-sweetened” positioning is central to your brand, use leaf-extracted Reb A or enzymatically converted Reb M whose substrate is leaf-derived.
Does Reb M work in baking and heat-processed foods?
Yes. Both Reb A and Reb M retain > 95 % of their sweetness through typical baking, pasteurisation and UHT conditions (pH 3–4, up to 80 °C for 2 hours). Reb M’s solubility limitation is relevant only in clear, cold-dilute systems. In baked goods, dairy, sauces and confectionery, the matrix is thick enough to suspend undissolved Reb M, and the processing temperature is high enough to dissolve it completely during manufacture.
Why is Reb M so much more expensive than Reb A?
Reb A is 2–4 % of stevia leaf dry weight and is commercially extracted using mature, low-cost technology. Reb M is < 0.1 % of the leaf — roughly 20–40× less abundant — so leaf extraction is economically impractical. Commercial Reb M is produced via enzymatic bioconversion (starting from Reb A) or fermentation (starting from simple sugars), both of which involve higher processing costs, lower yields and more complex purification. As fermentation capacity scales and enzymatic efficiency improves, the price gap is expected to narrow, but it is unlikely to close entirely within the next 5–10 years.
What is the ADI (acceptable daily intake) for Reb A and Reb M?
JECFA sets the ADI for all steviol glycosides collectively at 0–4 mg per kg of body weight per day, expressed as steviol equivalents. This applies to Reb A, Reb M, Reb D, stevioside and all other approved steviol glycosides. For a 70 kg adult, that is up to 280 mg of steviol equivalents per day — well above the amount consumed even by heavy users of stevia-sweetened products. The ADI does not distinguish between Reb A and Reb M; both are metabolised to steviol and steviol glucuronide via the same pathway.
How does Reb A vs Reb M compare to Reb D vs Reb M?
Reb D sits between Reb A and Reb M in most dimensions: 5 glucose units (vs 4 for Reb A and 6 for Reb M), moderate bitter shielding, intermediate solubility. Its taste profile is closer to Reb M than to Reb A, but its extremely low water solubility (< 0.05 % at 25 °C) makes it difficult to use in clear beverages. For a detailed analysis, see our Reb D vs Reb M comparison.
References
References
Sensory evaluation
[1] Muenprasitivej N, Tao R, Kettawan A, Rattanavichai W, Suwonsichon S. Sensory characterisation and consumer perception of steviol glycoside rebaudioside sweeteners. Foods. 2022;11(18):2859. doi:10.3390/foods11182859
[2] Saraiva A, Alves M, Soares C, Lemos ET, Figueirinha A, Ramos F. Steviol glycoside-based ice cream: sensory acceptance and consumer attitudes towards sugar-reduced dairy desserts. Foods. 2023;12(4):821. doi:10.3390/foods12040821
Structure & mechanism
[3] Wang Z, Qi J, Luo X, Chen W. Structure–taste relationship of steviol glycosides: concentration-dependent potency and C-13/C-19 functional differentiation. J Agric Food Chem. 2025. (Concentration-dependent potency data: Reb A Pw 435× at 2 % SE, 238× at 10 % SE; C-19 desorption mechanism.)
[4] Gao Y, Chen H. Molecular docking and binding affinity of steviol glycosides to human sweet taste receptor T1R2/T1R3. ChemRxiv. 2024. (VFD2 binding energies: Reb M −135.74 kcal/mol; Reb A −104.33 kcal/mol; Kd with G protein: Reb M 0.2797 nM.)
Formulation & stability
[5] Prakash I, Dubois GE, Clos JF, Wilkens KL, Fosdick LE. Development of next generation stevia sweetener: rebaudioside M. Foods. 2014;3(1):162–175. doi:10.3390/foods3010162
Bitter receptor
[6] Hellfritsch C, Behr J, Gönner M, Raithel M, Somoza V. Human psychometric and taste receptor responses to steviol glycosides. J Agric Food Chem. 2012;60(27):6782–6793. doi:10.1021/jf301297n
Modified stevia
[7] Supplier-reported sensory evaluation data (glycosylated Reb A). Bitterness reduction from 5.3 (standard Reb A) to 2.7 (glycosylated) to 1.6 (glycosylated + erythritol 1:1); potency reduction from 235× to ~155×. These figures are cited from commercial application notes provided by enzyme-modified stevia producers and have not been independently verified in peer-reviewed literature as of October 2026.
Market & regulatory
[8] BeverageDaily and industry reports. Global stevia market estimated at $1.4 billion (2025), projected $2.5 billion by 2035 at 6.2 % CAGR. Reb A approximately 60 % of commercial volume. Coca-Cola blended stevia (including Reb M) into Coke Zero formulations 2023–2024.
[9] FDA GRAS Notices: GRN 252 (Reb A, 2008); GRN 512 (Reb M, 2014). FDA GRAS database
[10] Commission Regulation (EU) No 231/2012, as amended. Steviol glycoside E 960 (Reb A, 2011); E 960c (Reb M, 2021–2022). EUR-Lex
[11] CIRS-Group. Regulatory overview of steviol glycosides: China GB 1886.355; Japan JSFA; JECFA ADI 0–4 mg/kg bw/day steviol equivalents. CIRS-Group.com
Written by
Xinjuan XuAssociate Professor of Food Science. Xinjuan writes stevia and steviol glycoside technical content, drawing on published literature and formulation research.
Reviewed by
FloraPhytoVale technical-content team. Flora reviews product and ingredient guides for accuracy, readability and alignment with supplier-side experience.
Disclaimer — PhytoVale supplies both ingredients compared in this article. This content is provided for informational purposes only and does not constitute medical, legal or regulatory advice. Always verify claims against the primary literature and regulatory texts cited above and consult qualified professionals for product-specific decisions.